How this place came to be
The Nez Perce people knew this valley as home long before there was a county, and never stopped. The towns, the sawmills, a lettuce boom and a bronze foundry came later, and each left records. Six chapters and two essays follow those records, and say where they fall silent.
For anyone tracing a family, a building or a business. For the people who keep the county’s museums, libraries and archives. For a newcomer who wants to know why the place looks the way it does.
Start here ↓
Three to read first.

The valley they kept coming home to
The people who were here first are here now. Start with them.
Read it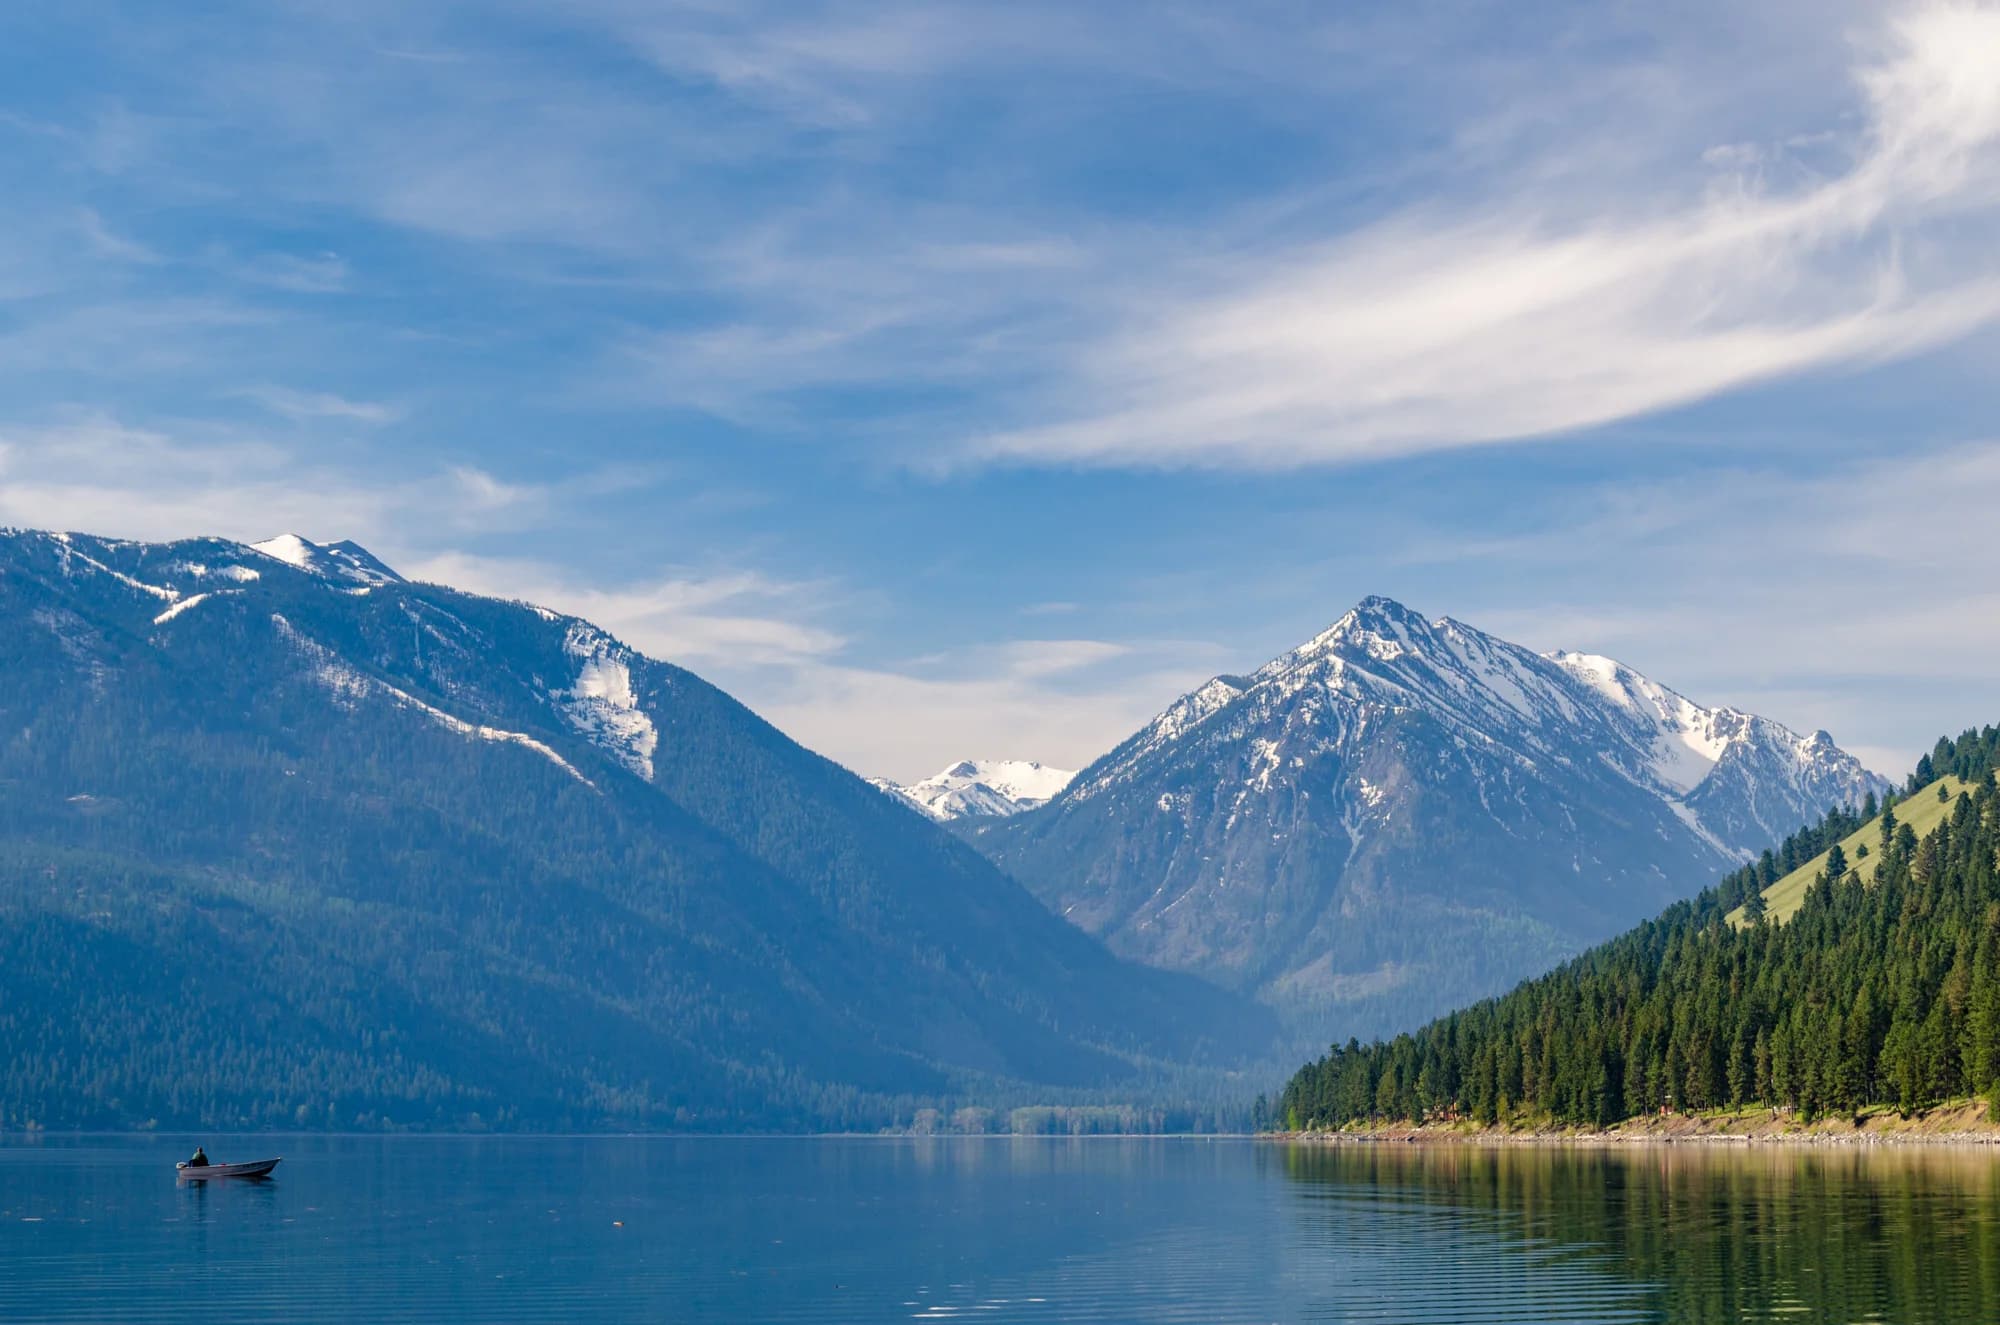
Fish, farms, and the ridge above the lake
Eight dams, a lake dam built with no way past it for a fish, and the ridge the county bought.
Read it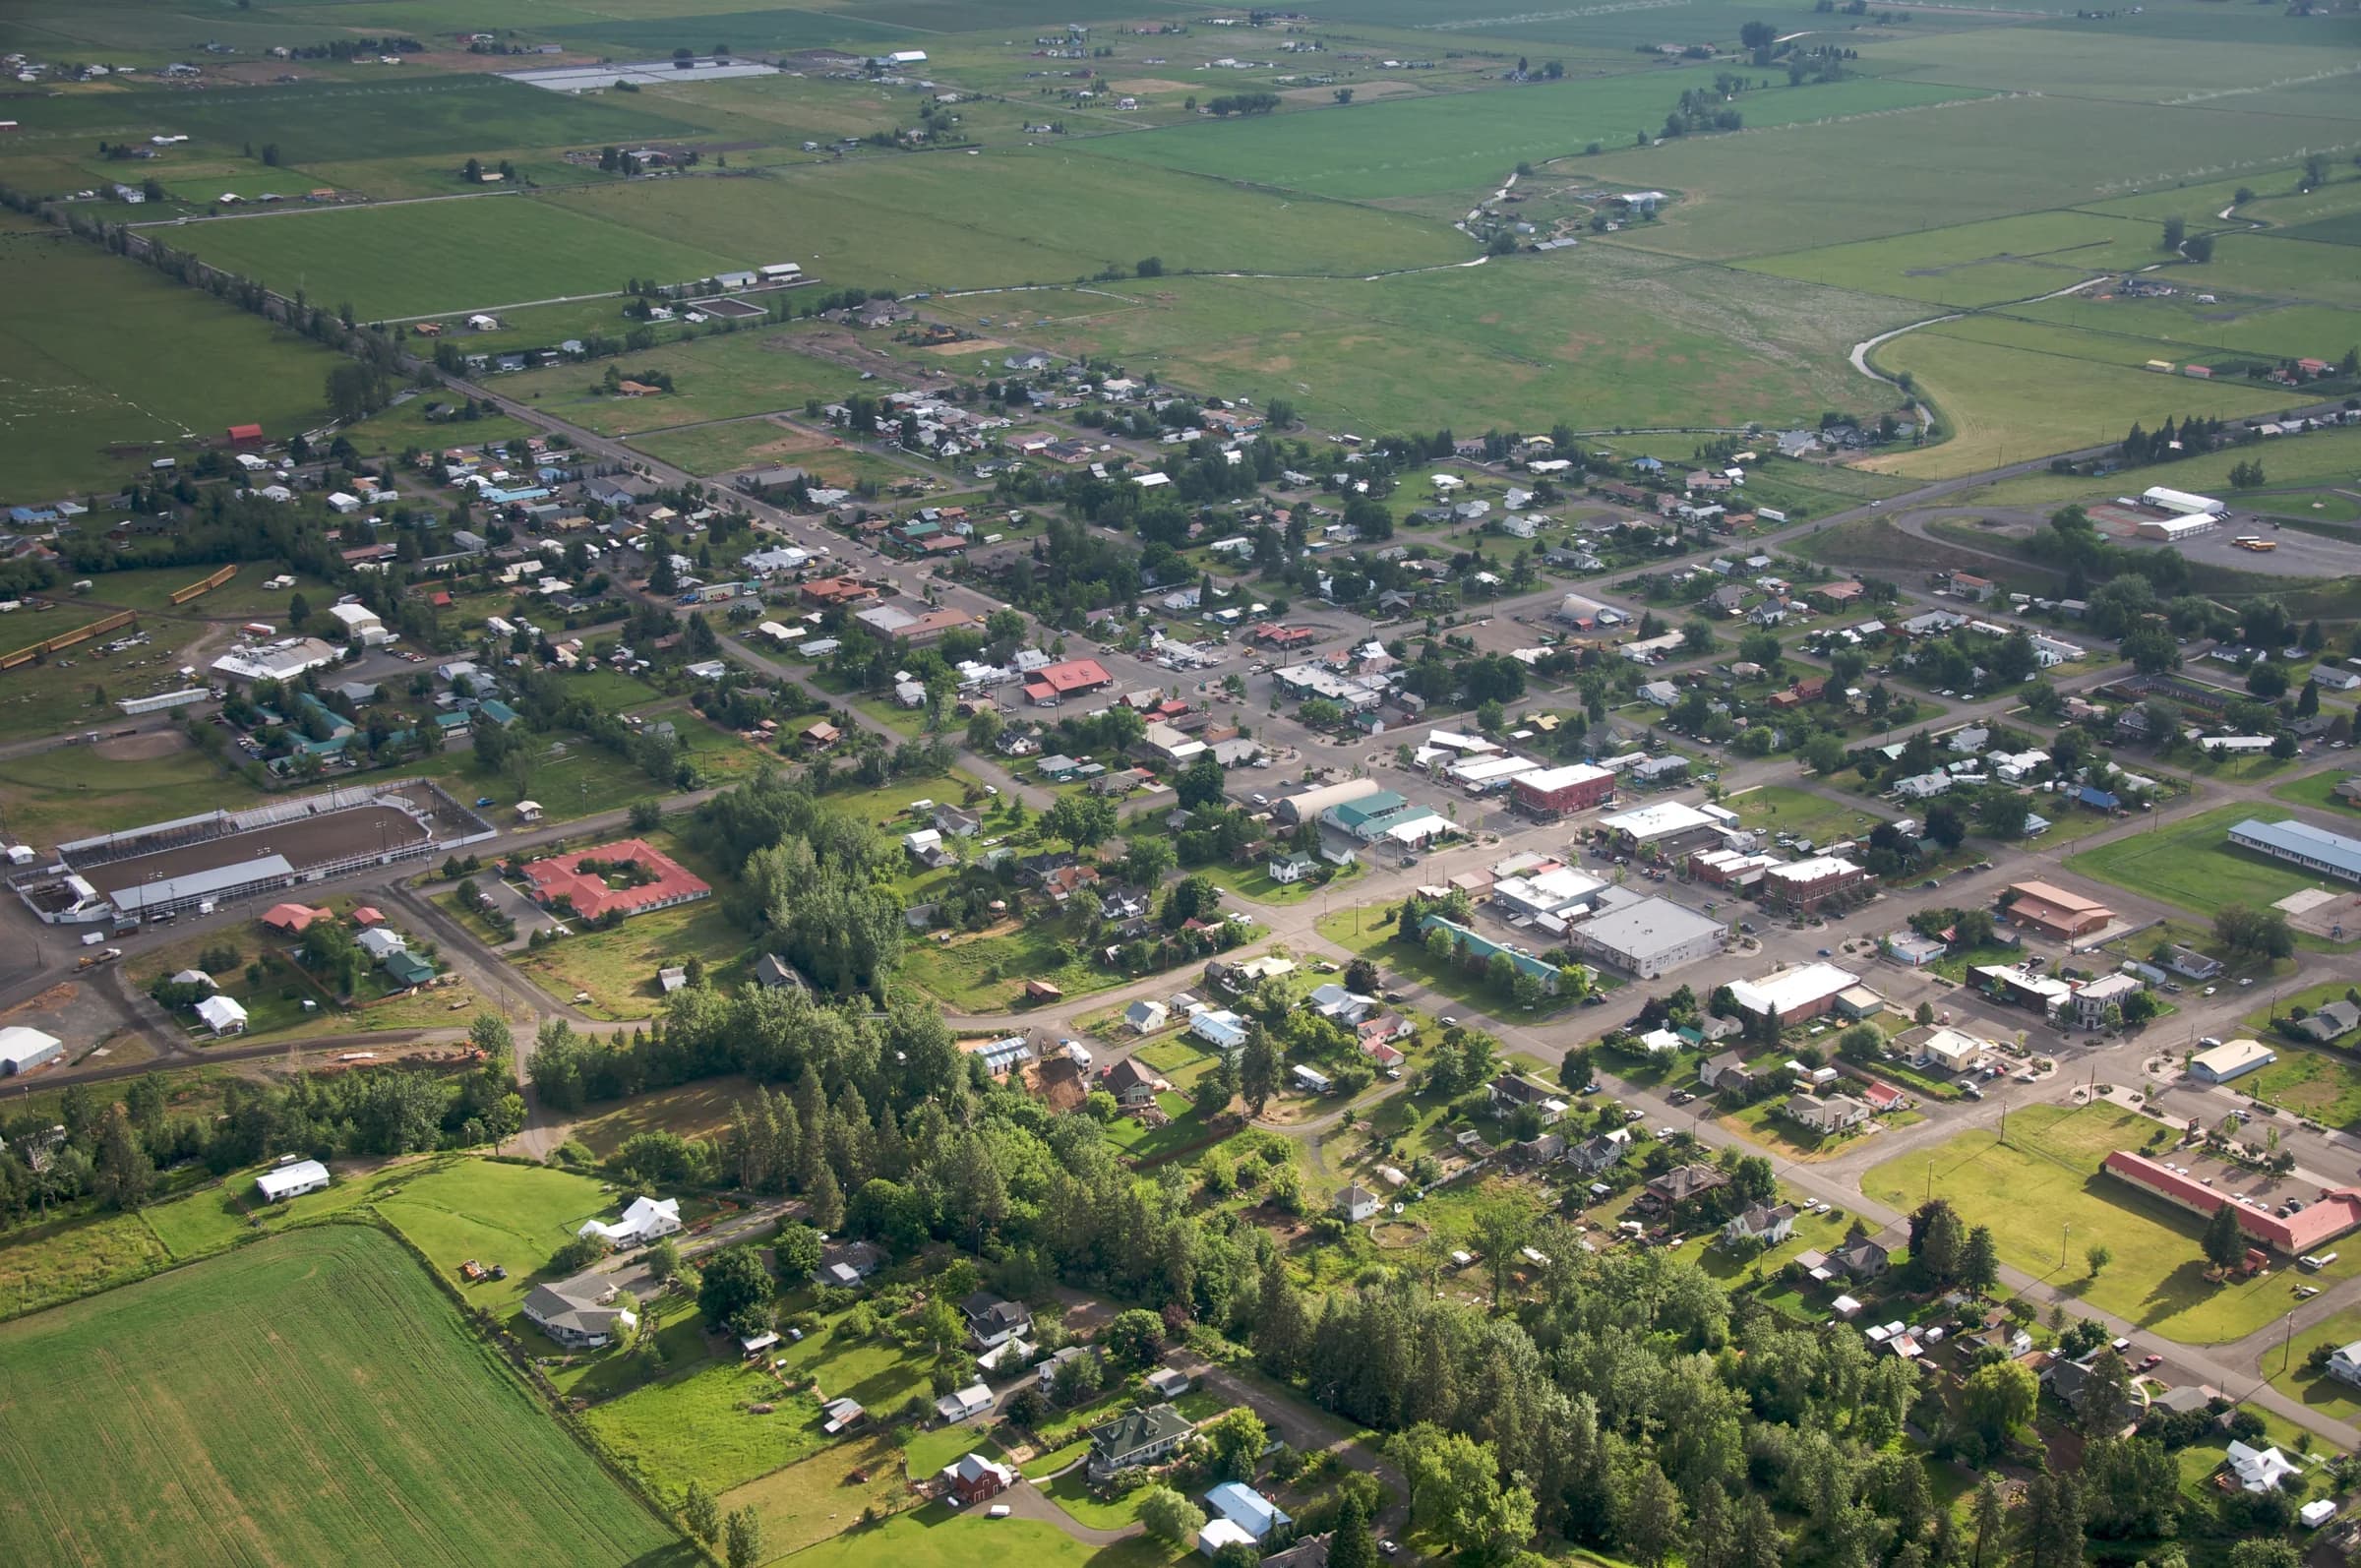
Lettuce, a carousel, and firewood bound for Dallas
Lettuce country, a horse-powered carousel and firewood sold in Dallas: what people tried before.
Read itWhat the record shows.
About the same number of people for sixty-five years
Census counts since 1960 and the state’s official forecast to 2045.
The county has stayed between about 6,200 and 7,400 people since 1960. The forecast assumes 36 more people a year move in than move out from 2026, and expects deaths to outnumber births three to one by 2040. The forecast figures are the sum of its age table.
Sources: U.S. Census Bureau, 1973 (data as of April 1, 1970 and 1960); U.S. Census Bureau, 2012; U.S. Census Bureau, April 1 counts, 2000, 2010, 2020; Population Research Center, Portland State University, for the Oregon Population Forecast Program (Marquez, Sharygin, Loftus, Alkitkat, Montcho, Swanson and Wilde, 2023), June 25, 2023
The numbers as a table
| People | |
|---|---|
| 1960 | 7,102 |
| 1970 | 6,247 |
| 1980 | 7,273 |
| 1990 | 6,911 |
| 2000 | 7,226 |
| 2010 | 7,008 |
| 2020 | 7,391 |
| 2025 (forecast) | 7,406 |
| 2035 (forecast) | 7,184 |
| 2045 (forecast) | 6,717 |
More to read.
Watch this part of the story.
 Video
The Wallowa Story
From Wallowa History Center · Date unconfirmed
 Video
The 1866-67 Survey of Wallowa County, Oregon and Nez Perce Resistance
From Wallowa History Center · Date unconfirmed
 36:55
The Legend of the “Hen Party”: Horsewomen of the Wallowas | Oregon Field Guide
From Oregon Public Broadcasting · 2024
 Video
Oregon Historic Cemeteries and the 1879 Robbery of Old Chief Joseph’s Grave
From Wallowa History Center · Date unconfirmed
 Video
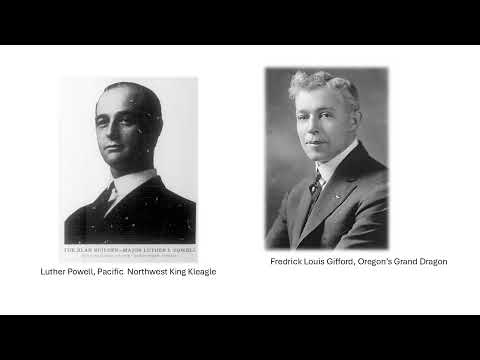
David Weaver- The Ku Klux Klan Comes to Wallowa County 1920-1925
From Wallowa History Center · Date unconfirmed
 1:00:54
Bob Webb: Preserving our History & Family Stories
From Josephy Center · 2026
The records behind it.
Wallowa History Center
A volunteer-built research library and interpretive center in Wallowa’s old ranger station, with more than 4,000 documents and objects, newspapers back to 1868, and a quarterly of its own.
Wallowa County Museum
Local historical collections inside a former bank on Main Street.
Josephy Center for Arts and Culture
An arts center where creative practice and regional history share a home.
Enterprise Mercantile & Milling Company building
The EM&M combines apartments and commercial spaces. Its history connects a 1930s demolition debate, county-financed rehabilitation, and present-day housing preservation.
First Bank of Joseph building
A Main Street building that connects banking and local historical memory.
OK Theatre
A theater whose opening was delayed by the influenza pandemic.
Add a name, a date or a photograph
If you hold a photograph, a name or a date that these pages are missing, one sentence is enough to start.
Add one thing