In October 2026 there were 79 homes for sale in all of Wallowa County, the most in years, and 17 of them cost less than $350,000. A two-bedroom rented for about $1,200 a month and a family house for $1,600 to $1,800. A new house cost about $375 a square foot to build, before anyone bought the land. A nurse who takes a job at the hospital has to live within twenty minutes of it. This is why that is hard, what the numbers can and cannot tell you, and what has been tried.
A guide · 1935 to 2026 · each figure carries its own year · Updated 19 October 2026
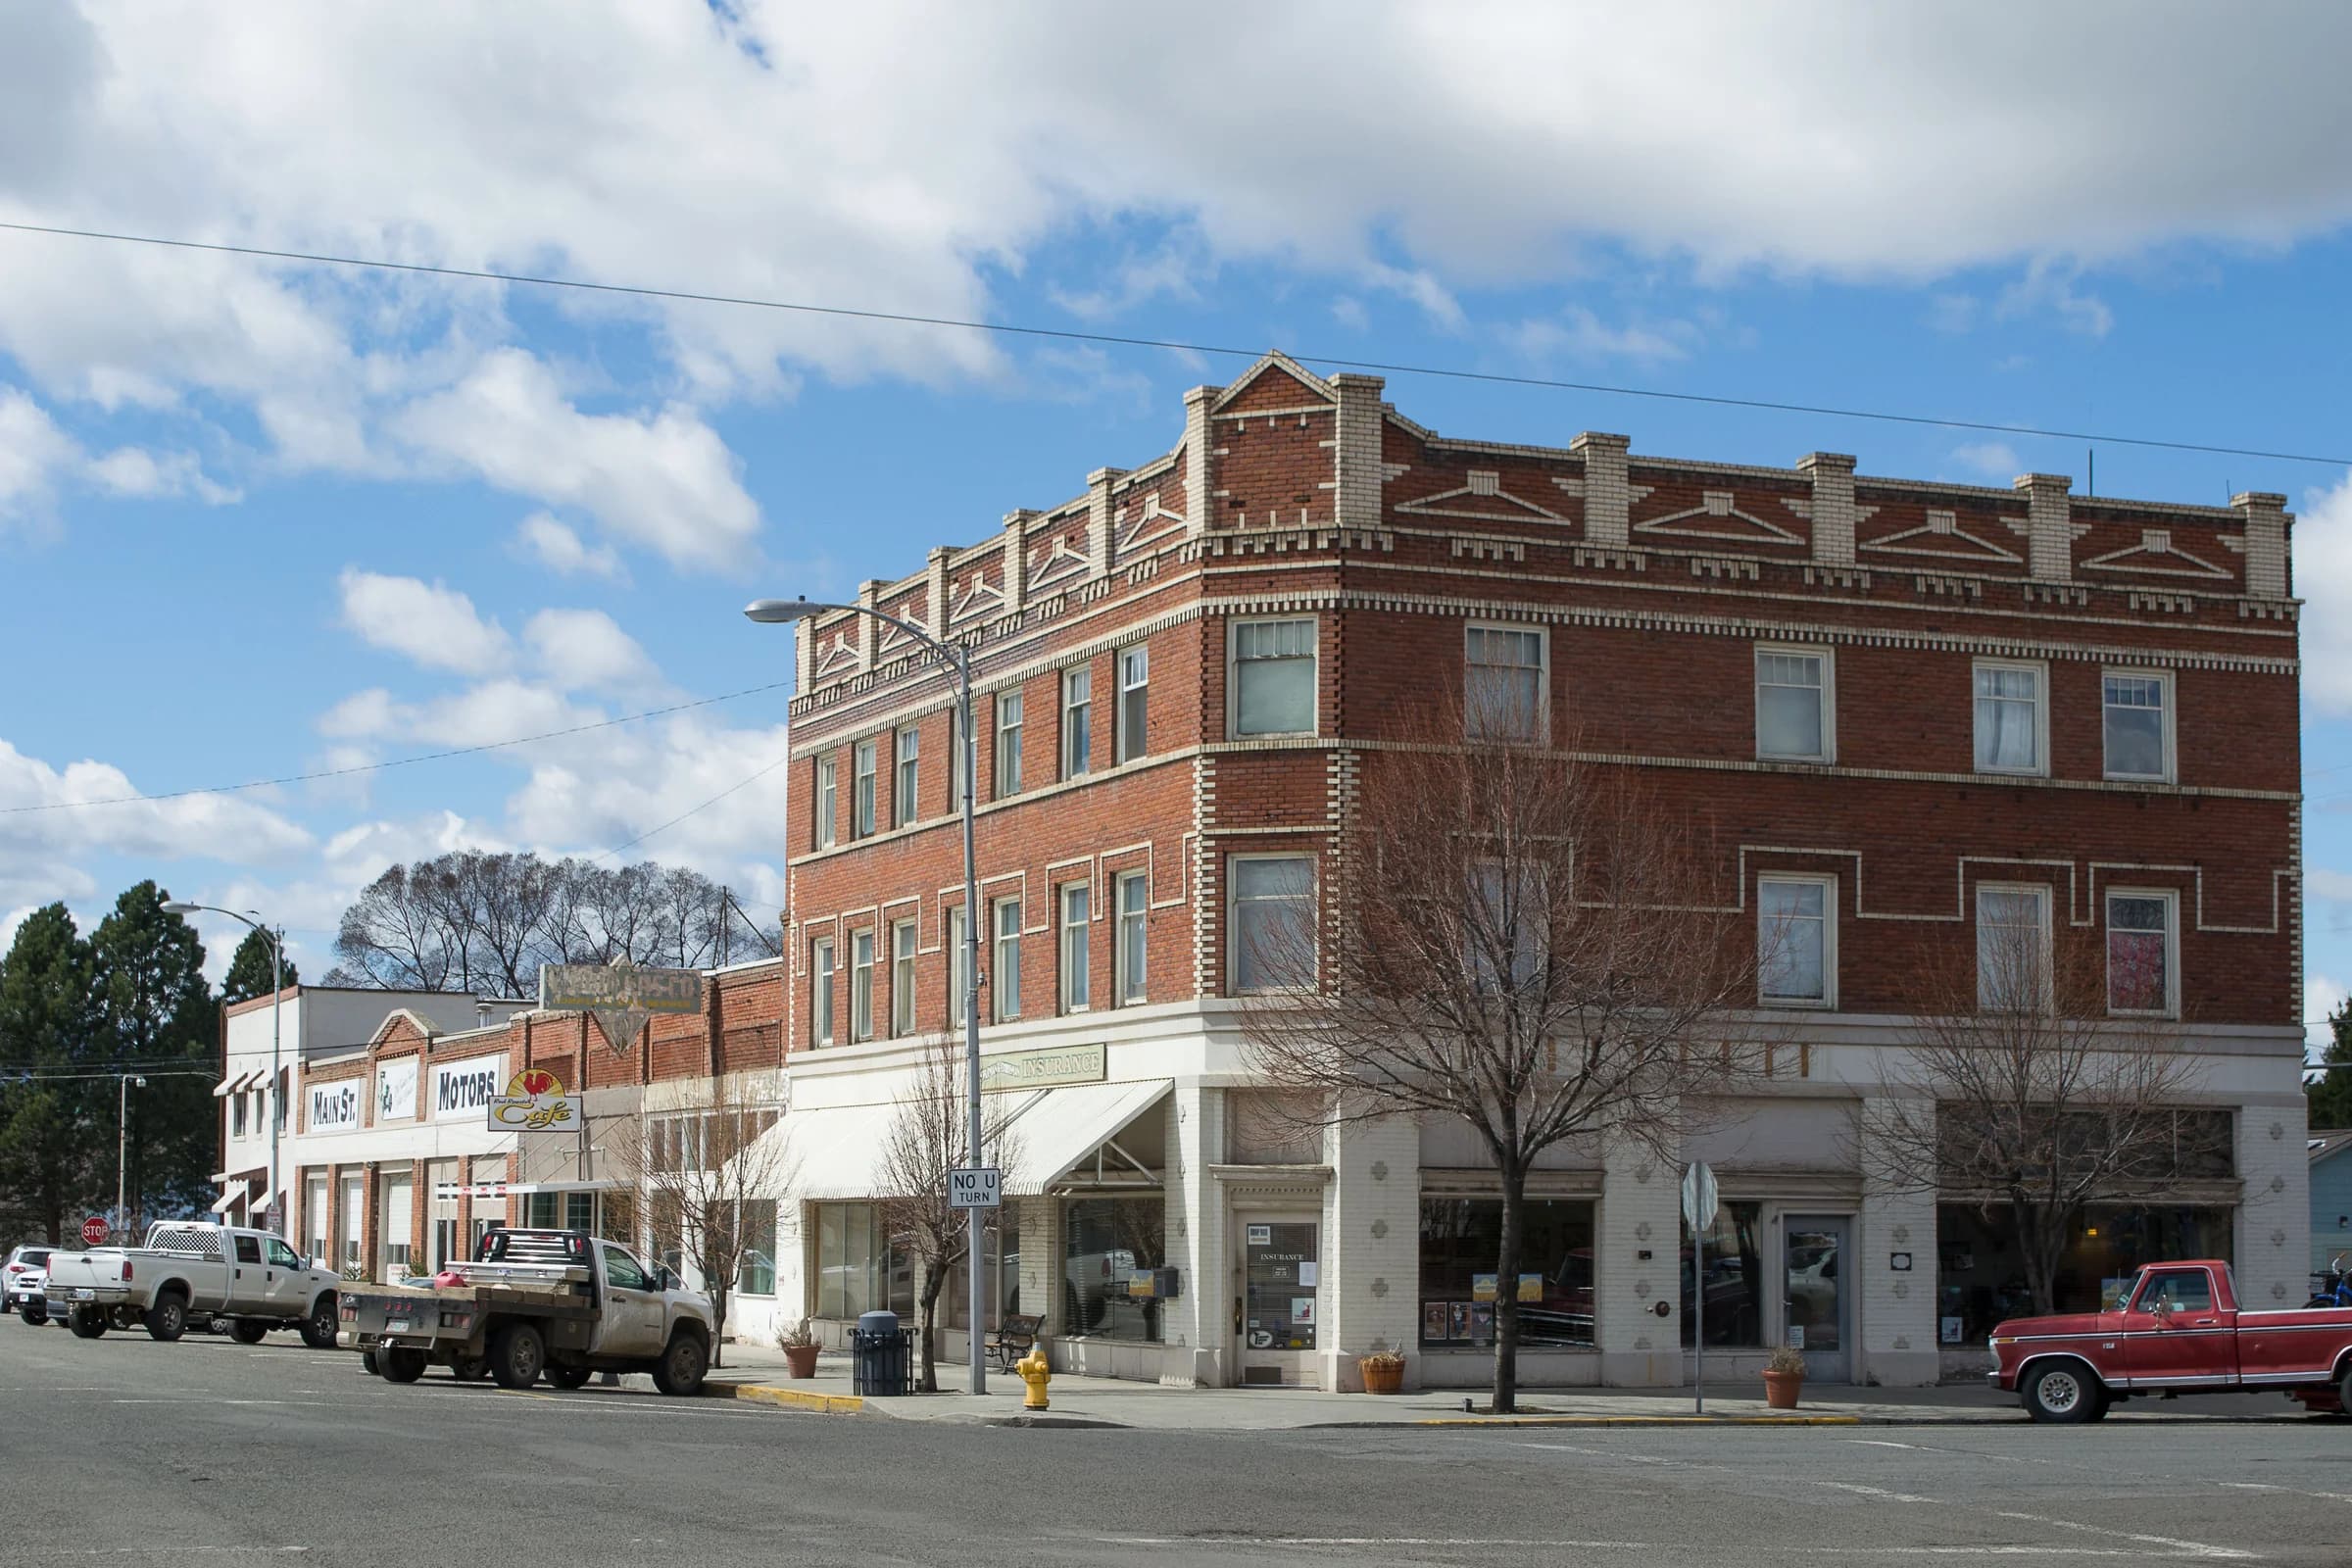
Enterprise and the fields around it, from the air in July 2007. Sam Beebe · 2007-07-08 · CC BY 2.0 · Image & source ↗
In this guide 5 sections
Analysis
A home has three prices, and a household pays all of them
The price on the listing is the one everybody quotes. The second price is what it costs to live there month to month: the mortgage or the rent, the heat, the roof when it goes. The third is the price of getting in at all: a deposit, a move, a bank willing to lend on an eighty-year-old house. A family can clear one and fail at the next.
Enterprise’s EM&M building shows why the second and third prices matter as much as the first. Nobody added an address to the map when Working Homes bought it in 2024. It is rewiring and repairing 27 apartments with people still living in them. Whether that counts as housing depends on what the rent and the utilities are when the work is done, and who gets the apartments. Those are the numbers to ask for.
The census puts the county’s median rent at $981 a month and its median household income at $67,112. Both are averages of five years, 2020 through 2024, in 2024 dollars. Neither is a rental listing from this fall, and the median household owns its home, so it is not the median renter. Divide one by the other and you have learned nothing about who can afford what.
The count of homes is the same. The census counts 4,349 housing units in the county, 962 of them vacant and 630 of those kept for the season. It does not say how many are for rent year-round, how many sit empty between summers, or how many a bank would finance.
Homes
One home in seven is kept for the season
The county’s 4,349 homes in the 2020 to 2024 estimates.
78% Lived in year-round3,387
14% Vacant, kept for seasonal or recreational use630
8% Vacant for other reasons: for sale, for rent, between tenants, other332
The seasonal count is the only published measure of second homes, and it misses homes owned from outside but rented out. People in conversation put the second-home share at about one in four; the two people who sell houses said most true second homes are cabins at the head of the lake.
Vacant for other reasons: for sale, for rent, between tenants, other
332
7.6%
Homes
A typical home is worth almost six years of a typical household’s income
Median value of an owner-occupied home$394,800
Median household income, a year$67,112
Median means the middle: half of homes are worth more, half less. Dividing one by the other gives about 5.9. People in conversation put it as ‘about $65,000 against a house just under $400,000’, which the record bears out.
Seventy-nine homes were for sale, and seventeen cost under $350,000
Seventy-nine homes were listed for sale in the county in early October 2026, the most in a long time. Seventeen were priced between $250,000 and $350,000. Several of those were manufactured homes, and some could not be financed at all. A two-bedroom rented for about $1,200 a month and a family house for $1,600 to $1,800. One office took calls for rentals a couple of times a week and had almost nothing to offer. The buyers who were left paid cash or waited on a sale somewhere else. The young families who came home and bought when mortgage rates were near 3% had stopped.
The same office’s sales cards say who has been buying. Of its 486 buyers over six years, 236, almost half, were from the county or returning to it, and the next largest group came from western Oregon. The cards show the median house in Joseph going from $256,000 in 2020 to $550,000 in 2025. One office’s sales are not the whole market, and the cards’ “investment or second home” column counts local buyers and storefronts too. It is not a count of second homes.
A Ruby Peak Realty broker put building cost and interest rates first when asked what stands between a working household and a house here: a buildable lot with utilities in a Joseph subdivision runs about $100,000, and a buyer in October 2026 was quoted about $375 a square foot for new construction. “How can you build an affordable home, under $300,000, with that cost?” On the second homes that come up in nearly every conversation about housing: “I really don’t think it’s the second homes that are the main problem.”
The same broker’s reading of the county-wide figure: a second-home share of about one in four includes the cabins and condominiums at the south and west ends of Wallowa Lake, which are not suited to year-round living. Among residential homes in the three towns the share is smaller, and that is the number that matters for housing. A count built from where tax statements are mailed would also sweep in rentals, investment property and holdings in trusts or companies, which is one more reason nobody has a clean figure.
Homes
The median house in Joseph doubled in five years
2020 median sale2025 median sale
Joseph$256,000 (20 sales)$550,000 (22 sales)
Enterprise$225,000 (37 sales)$395,000 (33 sales)
Wallowa$190,000 (5 sales)$449,000 (15 sales)
Wallowa Lake$355,000 (17 sales)$378,000 (6 sales)
One brokerage’s broker-involved sales from the regional listing service, as summarised on its yearly cards and shared with the Record. Small counts move the medians, especially in Wallowa and at the lake. Joseph roughly doubled in five years. People in Wallowa described the rise as a Joseph export, moving down the valley as buyers are priced out of Joseph, then Enterprise.
The 486 buyers one brokerage served from 2020 through 2025.
49% From Wallowa County, or returning to it236
23% From western Oregon111
29% From elsewhere: eastern and central Oregon, Washington, Idaho, California and beyond139
Ruby Peak Realty’s own tally, corrected by the office in October 2026: 48.5% local or returning, the largest single group but not a majority, and 22.8% from western Oregon. One office’s buyers, not the whole market. The office’s ‘investment or second home’ column mixes local buyers and commercial property, so it is not a second-home count.
When the hospital asked the county’s institutions in 2025 what its people needed most, the answer was housing, ahead of every medical need on the list. A recruit who accepts a job and cannot find a place to live does not come. That is the view of the people the assessment interviewed, not a census of employers.
Early in the pandemic the hospital opened a day care for its own staff, with room for about sixteen children, because a job offer on its own was not enough. A house, a day care, a drive to work and a parent who needs looking after all have to line up for a family to move. A housing plan that solves one and ignores the rest is why a family that wants to come still cannot.
A rising house price is good news for the family that owns one and a closed door for the family trying to buy. Every housing number describes somebody’s position, and the first question about any proposal is whose.
New construction and repair both add homes. What they add depends on the price, the location, who qualifies, what the place costs to heat, and how long any affordability condition lasts. The table below says what each approach is for and what you would need to know to judge it.
Publication: undated. Locator: City of Enterprise; EM&M Building; paragraphs 1–3. Owner’s account; last remaining affordable claim is not an independently tested inventory.
Shannon Weidemann (McKone), Elkhorn Media Group · Examined 2026-09-13
Publication: 2026-09-02. Locator: EM&M paragraphs and five-item Current upgrades list. Separate publication, but project account centers on Working Homes; no tenant interviews or independent completion inspection stated.
Read September 13, 2026. Locators: Age and Sex, Housing, Income & Poverty, Businesses. Age figures use V2025; housing costs/income are 2020–2024 estimates in 2024 dollars; nonemployer counts are 2023. Median gross rent is not a current asking rent. Web page examined; direct archival fetch returned 403.
Sales cards (RMLS broker-involved sales) shared by one of the office’s principal brokers on October 2–3 and 8, 2026; listing, rent, lot and construction-cost figures from a principal broker on October 5 and 7, 2026. The brokers asked, in writing, that the figures be credited to the office rather than to them by name. One office’s sales, not the whole market; the ‘investment or second home’ column includes local buyers and commercial property.
Oregon Office of Rural Health / Wallowa Memorial Hospital · Examined 2026-09-13
2025 assessment; PDF pages 1–2, priorities, housing and care access. Survey estimates and key-informant perspectives, not a housing inventory or a referendum. Summary combines data from different reference years.
Robert Barclay et al., Flex Monitoring Team · Examined 2026-09-13
Publication: 2025-03. Locator: Printed/PDF p. 5, opening Wallowa Memorial paragraph; p. 4 Quality of Life. Short case study, no item-level source for Wallowa interview or outcome statistics. PDF extraction contains an unrelated 2021 text layer; visible March 2025 title governs.